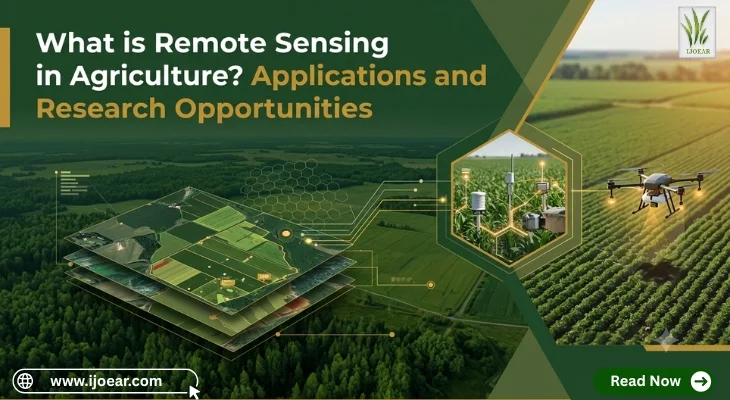
Agriculture increasingly depends on accurate, timely information to improve crop productivity, manage natural resources, and respond to changing environmental conditions. Traditional field inspections remain valuable, but they may not provide enough information to monitor large agricultural areas or identify problems before they become visible across an entire field. Remote sensing helps address these challenges by collecting information about crops, soil, water, and other agricultural features from a distance.
Remote sensing in agriculture refers to the process of obtaining information about farmland without directly touching or sampling every part of it. This information is commonly collected using satellites, aircraft, drones, and sensors that measure reflected or emitted energy from the Earth's surface.
The resulting data can help farmers, researchers, agricultural consultants, and policymakers understand crop conditions, monitor land use, assess drought, estimate yields, and evaluate agricultural practices. When combined with geographic information systems (GIS), weather data, field observations, and artificial intelligence, remote sensing becomes an important tool for data-driven agricultural management. Many of these workflows overlap with the technologies covered in our guide to precision agriculture technologies, benefits, and real-world examples.
What Is Remote Sensing and How Does It Work?
Remote sensing is a scientific technique used to observe and measure objects or environmental conditions from a distance. In agriculture, sensors collect information about the energy reflected or emitted by crops, soil, water, and other surfaces.
Different materials interact with electromagnetic radiation in different ways. Healthy vegetation, for example, generally absorbs much of the visible red light used in photosynthesis and reflects a relatively large proportion of near-infrared radiation. Stressed vegetation may exhibit different spectral characteristics depending on the cause and severity of the stress.
By analyzing these patterns, researchers can identify differences in crop growth, vegetation cover, moisture conditions, and other characteristics.
The Main Steps in Agricultural Remote Sensing
1. Data collection
Satellite instruments, drones, aircraft, or ground-based sensors collect information from agricultural fields. The type of sensor and platform depends on the monitoring objective, required resolution, available budget, and frequency of observation.
2. Data processing
Collected imagery may require geometric correction, atmospheric correction, cloud masking, calibration, and other processing steps. These procedures help make observations more suitable for comparison and analysis.
3. Image analysis
Researchers analyze processed data using spectral bands, vegetation indices, classification methods, time-series analysis, or machine learning. The selected method depends on the crop, location, season, and research question.
4. Ground validation
Remote sensing results are compared with field measurements, crop observations, soil samples, or other reliable reference data. Ground validation is essential because similar spectral patterns can sometimes be caused by different agricultural conditions.
5. Decision-making
The final information can support decisions about irrigation, nutrient management, pest surveillance, crop insurance, yield forecasting, land-use planning, and agricultural research.
Types of Remote Sensing Used in Agriculture
Agricultural remote sensing includes different sensing technologies and observation platforms. Each has particular strengths and limitations.
1. Satellite Remote Sensing
Satellites observe large geographical areas and provide repeated measurements over time. They are especially useful for regional crop monitoring, vegetation mapping, drought assessment, and agricultural land-use analysis.
Optical satellite systems capture reflected sunlight across different spectral bands. Multispectral imagery records a selected set of bands, while hyperspectral systems collect information across many narrower, often contiguous bands.
Satellite observations can support crop mapping, seasonal vegetation monitoring, and regional agricultural assessments. However, optical observations may be affected by cloud cover, haze, and atmospheric conditions. Spatial resolution and revisit frequency also influence whether a particular satellite is suitable for a specific application.
2. Drone-Based Remote Sensing
Unmanned aerial vehicles, commonly called drones, can collect high-resolution images over individual farms, experimental plots, and research fields.
Drones may carry RGB cameras, multispectral sensors, thermal cameras, or other specialized instruments. Researchers can use the resulting data to study crop establishment, plant density, canopy variation, lodging, irrigation patterns, and visible signs of stress.
Drone-based monitoring is particularly useful when detailed information is needed from a relatively small area. Flight regulations, battery life, weather, sensor calibration, processing requirements, and operating costs must all be considered. These platforms are also central to the developments discussed in agri-robotics and autonomous machines transforming modern agriculture.

3. Aerial Remote Sensing
Aircraft-mounted sensors can cover larger areas than many drone surveys while providing greater flexibility in data collection than some satellite systems.
Aerial remote sensing can be used for detailed agricultural mapping, crop inventory, soil variability assessment, and precision-farming applications. Its practicality depends on flight costs, project scale, sensor availability, and the need for repeated observations.
4. Thermal Remote Sensing
Thermal sensors measure emitted radiation associated with surface temperature. In agriculture, canopy temperature can provide useful information about plant water status and crop stress.
When plants have adequate water, transpiration can help cool their leaves. Under certain conditions, water-stressed plants may reduce transpiration and become warmer than surrounding well-watered plants.
Thermal imagery can therefore support irrigation scheduling and water-stress research. Temperature measurements are also affected by weather, wind, humidity, solar radiation, canopy structure, and the timing of observations. Thermal data should be interpreted alongside other measurements rather than treated as a direct, universal indicator of water stress. These principles are explored further in plant water consumption estimates using Blaney-Criddle versus Penman-Monteith.
5. Radar Remote Sensing
Radar systems transmit microwave energy and measure the signals returned from the Earth's surface. Unlike optical sensors, many radar systems can collect observations through cloud cover and during darkness.
Synthetic aperture radar (SAR) is useful for monitoring agricultural areas where clouds frequently limit optical observations. Depending on the sensor configuration and landscape, radar data can contribute to crop classification, flood monitoring, soil-moisture estimation, and assessment of field conditions.
Radar interpretation can be complex because the returned signal is influenced by vegetation structure, soil moisture, surface roughness, crop growth stage, and observation geometry.
Major Applications of Agricultural Remote Sensing
Remote sensing has applications throughout the agricultural production cycle, from land preparation and crop establishment to harvesting and post-harvest assessment.
1. Crop Health Monitoring
One of the most widely used applications is monitoring vegetation condition. Remote sensing can reveal differences in crop growth, canopy development, chlorophyll-related characteristics, and vegetation cover.
Vegetation indices simplify these observations. The Normalized Difference Vegetation Index (NDVI), for example, uses red and near-infrared reflectance to characterize vegetation greenness.
NDVI can help identify areas with relatively vigorous or sparse vegetation. It does not diagnose a specific problem by itself. Nutrient deficiencies, water stress, disease, soil variation, and differences in planting dates may all produce similar patterns.
Combining vegetation indices with field inspection, weather information, and crop-specific knowledge improves interpretation considerably.
2. Precision Irrigation and Water Management
Water availability strongly influences agricultural productivity. Remote sensing can support irrigation management by identifying differences in crop condition, canopy temperature, evapotranspiration, and surface moisture indicators.
Satellite-based evapotranspiration estimates can help researchers assess agricultural water consumption across large areas. Thermal imagery may help identify fields experiencing potential water stress, while radar and other remote sensing methods can contribute to soil-moisture monitoring.
These observations can help prioritize field inspections and improve irrigation planning. Satellite observations do not automatically determine the exact amount of water required by every plant. Reliable irrigation decisions may also require soil measurements, crop growth-stage information, weather forecasts, and knowledge of the irrigation system. Related approaches appear in our coverage of water conservation and smart irrigation systems.
3. Soil Mapping and Soil Moisture Assessment
Remote sensing can support the mapping of soil-related characteristics, including surface moisture, salinity indicators, erosion patterns, and land degradation.
Bare-soil reflectance may contain information related to soil composition and surface properties. Radar observations can also be sensitive to near-surface moisture under suitable conditions.
Soil properties are difficult to estimate consistently from imagery alone. Vegetation cover, surface roughness, soil texture, organic matter, and atmospheric conditions can all affect the measured signals.
For reliable soil mapping, remote sensing is often combined with laboratory analysis, field sampling, terrain information, and digital soil mapping techniques. These datasets complement the indicators described in our guide to soil health indicators, testing methods, and management strategies.
4. Crop Identification and Acreage Estimation
Agricultural authorities and researchers need reliable estimates of the area planted with different crops. Remote sensing helps classify land into crop categories and track changes in cultivated areas.
Multispectral satellite images, radar observations, and time-series data can distinguish crops through differences in their spectral characteristics and seasonal growth patterns. Rice, wheat, maize, and cotton, for instance, often exhibit different planting calendars, canopy development patterns, and harvesting periods. Observations collected throughout the growing season generally improve classification compared with a single image.
Crop identification supports agricultural statistics, food-security assessments, production planning, and market analysis. Accuracy depends on image resolution, crop diversity, field size, mixed cropping, and the availability of reliable reference data.
5. Pest and Disease Surveillance
Remote sensing can help identify areas where crops show signs of stress associated with pests or diseases. Changes in canopy reflectance, temperature, plant structure, and vegetation indices may indicate that a field requires closer inspection.
Drone imagery and hyperspectral measurements are particularly useful in experimental research investigating early indicators of plant stress.
Remote sensing generally cannot establish the precise cause of stress without additional evidence. Insects, fungal infections, nutrient deficiencies, water shortages, and chemical injury can produce overlapping symptoms.
An effective surveillance system combines remote sensing with field scouting, plant pathology, entomological observations, and, when necessary, laboratory diagnosis. Weather-driven forecasting models, such as the approach used in rice brown spot AI disease prediction, show how these layers can work together.
6. Crop Yield Estimation and Forecasting
Researchers can combine satellite-derived vegetation indicators, crop growth patterns, weather records, soil characteristics, and historical yield data to estimate likely production.
Time-series imagery can reveal how crops develop throughout the season. Machine learning models may then use these observations to estimate yield before harvest.
Such estimates can help governments, agricultural businesses, researchers, and food-security organizations plan for expected production levels.
Yield prediction remains challenging because final production also depends on extreme weather, pest outbreaks, management decisions, and events occurring late in the growing season. Models should be validated across multiple years and locations before being applied operationally.
7. Drought Monitoring and Climate Impact Assessment
Remote sensing provides valuable information for monitoring agricultural drought and evaluating the effects of climate variability.
Vegetation indices, land-surface temperature, soil-moisture products, and evapotranspiration estimates can help identify areas experiencing abnormal growing conditions.
Researchers can compare current observations with historical patterns to investigate the timing, extent, and severity of agricultural stress. These analyses may support drought early-warning systems, crop-loss assessments, and climate adaptation planning.
Different indicators measure different aspects of drought. A vegetation index, for example, may respond after crop growth has already been affected, while soil-moisture products may provide information about water availability under particular conditions. Combining several indicators usually produces a more complete assessment. The spatial modelling side of this work is covered in geospatial analytics for climate risk assessment in agriculture.
8. Land-Use and Land-Cover Mapping
Remote sensing is widely used to map agricultural land and examine changes in land use over time.
Researchers can identify shifts between cropland, forest, grassland, settlements, and other land-cover categories. These observations support studies of agricultural expansion, urbanization, land degradation, habitat loss, and the conversion of productive farmland.
Multi-year satellite imagery is particularly useful for detecting changes that are difficult to observe through isolated field surveys. Similar workflows underpin the methods described in monitoring tropical forest loss and the factors involved.
9. Crop Insurance and Agricultural Risk Assessment
Remote sensing can contribute to agricultural insurance by documenting crop development, assessing the extent of affected areas, and supporting large-scale crop-loss monitoring.
When combined with weather information, field records, and crop models, imagery may help insurers and public agencies investigate drought impacts, flooding, and other agricultural hazards.
Satellite-derived indicators should not automatically be treated as proof of an individual farmer's loss. Insurance applications require appropriate validation, transparent assessment methods, and compliance with relevant policy conditions.
Important Remote Sensing Indices and Measurements
Several indices and measurements are commonly used in agricultural research. Their suitability depends on the sensor, crop type, observation conditions, and intended application.
| Index or Measurement | Spectral Basis | Primary Agricultural Use | Key Limitation |
|---|---|---|---|
| NDVI | Red and near-infrared | Vegetation greenness, crop development | Saturates in dense canopy; influenced by soil background |
| EVI | Blue, red, and near-infrared | Vegetation monitoring in dense canopy | Requires more bands and careful calibration |
| NDWI | Varies by formulation (NIR/SWIR or green/NIR) | Vegetation water content or open water detection | Formula differs between studies |
| Land Surface Temperature | Thermal infrared | Crop stress, evapotranspiration, heat exposure | Not equal to air or leaf temperature |
| Evapotranspiration | Multi-band with weather data | Water accounting and irrigation research | Requires weather inputs and validation |
Normalized Difference Vegetation Index (NDVI)
NDVI measures the contrast between red and near-infrared reflectance. It is frequently used to monitor vegetation greenness, crop development, and spatial differences in plant cover.
NDVI is relatively straightforward to calculate and interpret, but it can become less sensitive in dense vegetation and may be influenced by soil background and atmospheric effects.
Enhanced Vegetation Index (EVI)
EVI was designed to improve vegetation monitoring in certain conditions by incorporating information from additional spectral bands and reducing some background and atmospheric influences.
It can be useful in areas with dense vegetation, although its performance still depends on data quality and sensor characteristics.
Normalized Difference Water Index (NDWI)
The term NDWI is used for more than one spectral index. Some formulations use near-infrared and shortwave-infrared bands to assess vegetation water content or moisture-related changes, while other formulations are designed to identify open water.
Researchers should specify the formula and intended interpretation when using NDWI in agricultural studies.
Land Surface Temperature (LST)
Land surface temperature represents the temperature of the observed surface as estimated from thermal measurements. It can support studies of crop stress, evapotranspiration, drought, and agricultural heat exposure.
LST is not identical to air temperature or leaf temperature. Its interpretation requires attention to spatial resolution, time of observation, land cover, and atmospheric conditions.
Evapotranspiration Estimates
Evapotranspiration combines evaporation from surfaces with water released by plants through transpiration. Remote sensing can contribute to estimating evapotranspiration using surface temperature, vegetation characteristics, radiation, and weather data.
These estimates can support agricultural water accounting, irrigation research, and assessments of crop water use.
The Role of GIS, Artificial Intelligence, and Machine Learning
Remote sensing becomes more powerful when integrated with other data and analytical methods.
Geographic Information Systems
GIS enables researchers to organize, visualize, and analyze spatial information. Satellite images can be combined with field boundaries, soil maps, elevation models, weather stations, irrigation networks, and administrative boundaries.
This integration supports field-level assessment as well as regional agricultural planning.
Machine Learning
Machine learning algorithms can identify patterns in large remote sensing datasets. Common applications include crop classification, yield prediction, land-cover mapping, and detection of unusual vegetation conditions.
Methods such as random forests, support vector machines, and gradient-boosting algorithms are used in agricultural research. Their performance depends on representative training data, suitable input variables, and independent validation.
Deep Learning
Deep learning methods, including convolutional neural networks and certain transformer-based models, can analyze spatial and temporal patterns in imagery.
They may be useful for crop-type identification, plant counting, weed detection, and the analysis of high-resolution drone images. However, they often require substantial training data and computing resources.
A model that performs well in one region may not generalize to another because of differences in climate, soil, crop varieties, sensors, and farming practices.
Cloud Computing and Time-Series Analysis
Cloud platforms can make it easier to process large volumes of satellite imagery without downloading every image to a local computer.
Time-series analysis allows researchers to examine how crop conditions change across planting, vegetative growth, flowering, grain filling, and harvesting stages. Seasonal patterns often provide more useful information than individual images.
Research Opportunities in Remote Sensing in Agriculture
Remote sensing offers opportunities for researchers in agronomy, agricultural engineering, soil science, environmental science, geoinformatics, computer science, and climate studies.
1. Early Detection of Crop Stress
Researchers can investigate whether multispectral, hyperspectral, or thermal imagery can identify crop stress before symptoms become clearly visible to the human eye.
Potential studies include controlled experiments comparing healthy plants with plants exposed to water shortages, nutrient deficiencies, salinity, or specific diseases. Strong research designs should include ground measurements and clearly defined stress conditions.
2. Precision Agriculture for Smallholder Farms
Small farms may face challenges related to the cost of imagery, limited connectivity, small field sizes, and access to technical expertise.
Research can evaluate low-cost drone surveys, freely available satellite imagery, mobile-based advisory systems, and cooperative remote sensing services. An important question is whether these technologies provide measurable benefits relative to their implementation costs. Similar affordability questions are explored in smart farming on a budget using solar IoT greenhouses.
3. Crop Yield Prediction Under Climate Variability
Researchers can develop and compare yield prediction models using satellite observations, rainfall, temperature, soil properties, and historical production data.
A promising research direction is assessing how well models perform during heatwaves, droughts, irregular rainfall, and other extreme conditions. Independent testing across different years and regions is essential to determine whether a model can support real-world forecasting.
4. Remote Sensing for Water-Efficient Agriculture
Agricultural water demand creates a strong need for better monitoring and management.
Research opportunities include evaluating satellite-based evapotranspiration estimates, combining thermal imagery with soil-moisture sensors, and developing irrigation recommendations based on crop growth stages.
Studies may also investigate how remote sensing can help identify over-irrigation, waterlogging, and inefficient water distribution. Related work appears in research on low-water precision irrigation systems.
5. Hyperspectral Remote Sensing for Crop Quality
Hyperspectral sensors capture information across many narrow wavelength bands. These measurements can reveal subtle differences in vegetation reflectance that may not be visible in conventional RGB imagery.
Researchers can investigate the potential of hyperspectral data for estimating chlorophyll-related characteristics, nutrient status, biochemical composition, and certain indicators of crop quality. Such studies require careful calibration, suitable reference measurements, and validation across different crop varieties and environmental conditions.
6. Combining Satellite and Drone Data
Satellite imagery offers broad coverage and repeated observations, while drones can provide highly detailed information over smaller areas.
Researchers can investigate methods for integrating the two data sources to improve crop mapping, stress detection, and yield estimation. Satellite observations may help identify areas requiring investigation, while drone surveys can provide detailed measurements for those locations.
This approach may be especially useful when satellite resolution is insufficient for small or fragmented fields.
7. Remote Sensing and Sustainable Agriculture
Remote sensing can help evaluate the spatial and temporal effects of agricultural management practices.
Potential research areas include cover-crop monitoring, conservation agriculture, crop rotation, vegetation cover, soil erosion risk, and changes in agricultural land use. Researchers can assess whether management interventions are associated with measurable changes in vegetation patterns and land-surface characteristics.
Soil sampling and field observations remain important when evaluating properties that cannot be measured reliably from imagery alone. The broader framework is described in our guide to sustainable agriculture principles, practices, and importance.
8. Explainable Artificial Intelligence for Agricultural Monitoring
Although AI models can produce accurate predictions, their decisions may be difficult to interpret.
Research can investigate explainable AI techniques that identify which spectral bands, environmental variables, or temporal patterns contribute to a prediction. Transparent models can help agricultural researchers assess whether predictions are scientifically plausible and whether a model may be relying on misleading correlations. Comparable questions arise in AI-powered phenotyping and genomics integration.
9. Remote Sensing for Climate-Smart Agriculture
Climate-smart agriculture aims to improve productivity, support adaptation to climate change, and, where possible, reduce greenhouse gas emissions or increase carbon storage.
Remote sensing research can contribute to monitoring crop responses to climate stress, mapping changing growing seasons, identifying drought-prone areas, and evaluating certain land-management indicators.
Carbon storage, emissions, and soil properties often require specialized methods and independent measurements. Satellite imagery alone cannot reliably quantify every climate-related outcome. The wider context is covered in climate-smart agriculture and how it addresses climate change.
Research Methodology: How to Conduct a Remote Sensing Study
A well-designed remote sensing project begins with a clear research question rather than simply collecting imagery.
Step 1: Define the Research Objective
Specify what you want to investigate. The study may aim to classify wheat fields, estimate crop water stress, map drought impacts, or predict yield.
A focused objective helps determine the appropriate sensor, data resolution, study period, and validation method.
Step 2: Select the Study Area and Crop
Identify the geographical area, crop type, growing season, and relevant environmental conditions. Consider field size, terrain, irrigation practices, and the availability of reference data.
Step 3: Choose Suitable Remote Sensing Data
Select satellite, drone, aerial, radar, thermal, or hyperspectral data according to the research objective.
Researchers may explore publicly accessible sources such as the European Space Agency's Sentinel missions and NASA's Earth-observation resources. Data availability, licensing, spatial resolution, revisit frequency, and sensor limitations should be checked before selection.
Step 4: Collect Ground-Truth Data
Ground-truth data provide independent observations against which remote sensing results can be evaluated.
Depending on the research question, these may include crop type, leaf area, plant height, chlorophyll measurements, soil moisture, disease severity, or harvested yield. The timing of field measurements should correspond as closely as practical to the remote sensing observations.
Step 5: Preprocess and Analyze the Data
Apply appropriate corrections, remove unusable observations, derive relevant indices, and prepare the data for analysis.
The method may involve classification, regression, spatial analysis, time-series modeling, or machine learning.
Step 6: Validate the Results
Evaluate the model using independent observations or a suitable validation design.
For classification, researchers may report overall accuracy, class-specific precision and recall, and a confusion matrix. For continuous predictions such as yield, suitable metrics may include root mean square error (RMSE), mean absolute error (MAE), and the coefficient of determination (R²).
Validation data should be separated carefully from training data. When observations are spatially or temporally correlated, random splitting alone may overestimate how well the model generalizes.
Step 7: Interpret Agricultural Significance
Explain what the results mean for farming, agricultural science, or environmental management.
A strong study does more than report a high accuracy score. It discusses uncertainty, practical usefulness, limitations, and whether the method could work in other regions or growing seasons.
Challenges and Limitations of Agricultural Remote Sensing
Despite its advantages, remote sensing has important limitations that researchers and practitioners must consider.
Cloud cover and atmospheric interference. Optical satellite imagery may be unavailable or degraded during cloudy periods. Radar can help fill some observation gaps but requires different processing and interpretation methods.
Spatial and temporal resolution. A satellite image may not capture the detail needed for very small fields or individual plants. Conversely, high-resolution drone surveys may not be practical for monitoring extensive regions frequently.
Data processing requirements. Large datasets may require specialized software, computing resources, technical skills, and careful quality control.
Ground-validation requirements. Remote sensing estimates are not automatically accurate simply because they are generated by advanced sensors or AI models. Reliable field measurements are essential for many applications.
Model transferability. Algorithms developed for one crop, region, or season may perform poorly elsewhere. Differences in soil, climate, varieties, and management can affect the relationship between sensor measurements and agricultural outcomes.
Cost and accessibility. High-resolution commercial data, specialized sensors, drones, and technical services may be expensive for some farmers and research institutions.
Interpretation uncertainty. Similar spectral responses may result from different causes. A remote sensing indicator should therefore be interpreted in context rather than treated as a definitive diagnosis.
Addressing these limitations requires appropriate sensor selection, transparent methods, independent validation, and collaboration between remote sensing specialists and agricultural experts.
Future Trends in Remote Sensing in Agriculture
The future of agricultural remote sensing will likely involve greater integration of different sensors, more frequent observations, improved analytical methods, and easier access to agricultural information.
Multi-sensor integration will combine optical, radar, thermal, and field-sensor data to improve monitoring under different environmental conditions.
AI-assisted agricultural monitoring will support crop classification, anomaly detection, yield forecasting, and the prioritization of field inspections. Reliable deployment will depend on model validation and uncertainty assessment.
Near-real-time analytics may help agricultural services deliver faster alerts about changing crop conditions, drought, or flood impacts when suitable data and processing systems are available.
Digital agriculture platforms will increasingly connect remote sensing with farm-management software, weather services, soil information, and machinery data.
More accessible satellite data and open-source tools can help students, researchers, and agricultural organizations develop monitoring systems without relying entirely on costly commercial datasets.
The most useful advances will be those that translate reliable observations into practical decisions while accounting for local farming conditions and the needs of different users.
Building Better Agricultural Decisions Through Remote Sensing
Remote sensing has become an important part of modern agricultural research and precision farming. By collecting information from satellites, drones, aircraft, and specialized sensors, it allows researchers and agricultural professionals to monitor crop development, assess water conditions, map farmland, estimate yields, and investigate environmental change.
Its value increases when remote sensing is integrated with GIS, field measurements, weather data, and carefully validated analytical models. These combinations can reveal patterns that are difficult to identify through occasional field inspections alone.
For researchers, opportunities range from early crop-stress detection and hyperspectral analysis to AI-based yield prediction, irrigation management, and climate adaptation. Successful studies must match the sensor and method to the research question, validate results with reliable observations, and communicate uncertainty clearly.
As agricultural systems face growing pressure to produce food efficiently while conserving natural resources, remote sensing can help turn spatial data into more informed and sustainable agricultural decisions.
Continue Exploring
- What Is Precision Agriculture? Technologies, Benefits, and Real-World Examples
- Geospatial Analytics for Climate Risk Assessment in Agriculture
- IoT Sensor Networks in Smart Farming: Automation, Pest Detection, and Future Research
- AI-Powered Phenotyping and Genomics Integration
- Latest Research on Low-Water Precision Irrigation Systems
- What Is Soil Health? Key Indicators, Testing Methods, and Management Strategies